OWS workflow
Why this heatmap matters
When you work with existing Option Omega strategies, different variants can of course be tested. In practice, DOE-like comparisons are often still done manually step by step.
That is where OWS adds value: two freely configurable parameters can be scanned in multiple combinations automatically. Typical examples are take profit 10%, 15%, 20% or different DTE levels.
What the heatmap shows
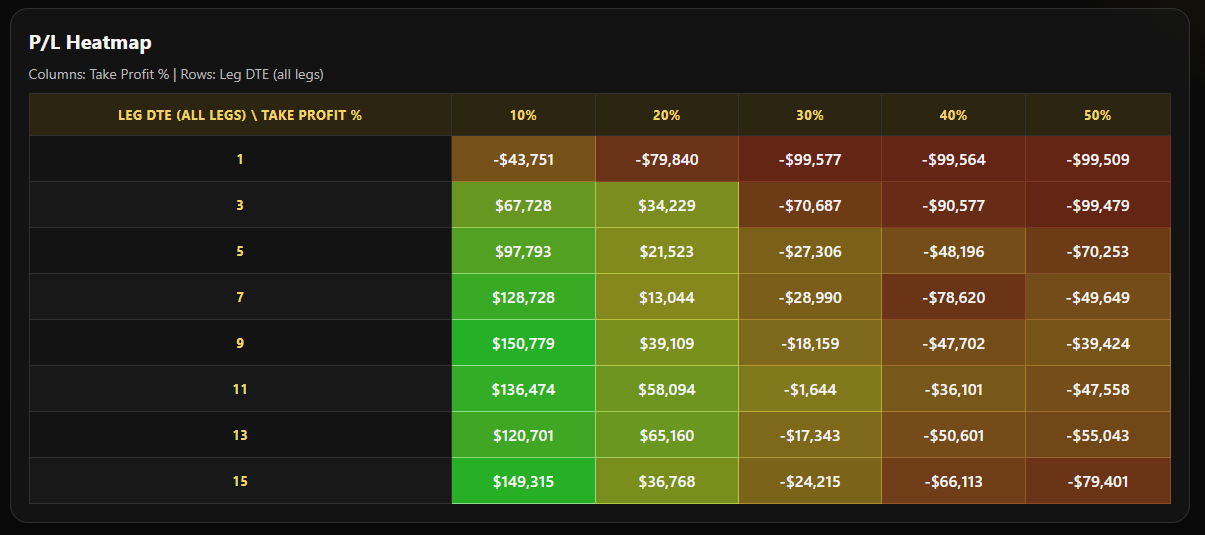
The goal is not only to find the highest profit. More importantly, it helps you see how stable a backtest remains across parameter changes and which setup was actually the most profitable.
- Parameter 1 can be a freely defined take profit.
- Parameter 2 can be DTE, stop loss, or an exit window.
- Heatmap makes it clear whether the result is robust or just noise.
- Time savings are substantial because runs no longer need to be launched one by one.
Example screenshot of a heatmap
Below is a small excerpt taken directly from a local Option Omega report, without any additional interpretation, simply as a visual example.
Prerequisite
This workflow requires an active Option Omega subscription. In addition, an existing strategy and its URL must be inserted into OWS.